Business Intelligence
Executive BI dashboards, data pipeline automation, KPI reporting, and predictive business analytics that drive informed decisions.
We turn disconnected spreadsheets and siloed business data into real-time, interactive executive dashboards. By building clean data pipelines that unify your sales, marketing, finance, and operational metrics, we give your leadership team clear clarity on business performance.
Core Frameworks & Tools
Engineered for high performance, search intent, and business conversion.
Transforming Scattered Business Data Into Clear Strategic Decision Power
Why centralized data pipelines, automated ETL workflows, and uncluttered KPI dashboards drive profitable growth.
In many growing companies, critical business data remains trapped across isolated silos: marketing metrics in ad platforms, sales numbers in a CRM, financial figures in accounting software, and inventory logs in messy spreadsheets. When executives need a holistic view of monthly profit margins or customer lifetime value, someone has to spend days manually copying numbers into Excel.
Verse Next builds modern business intelligence solutions that automate the entire data lifecycle. We extract data from your disparate software applications via APIs, clean and normalize the information through automated ETL (Extract, Transform, Load) pipelines, and store it in centralized data warehouses.
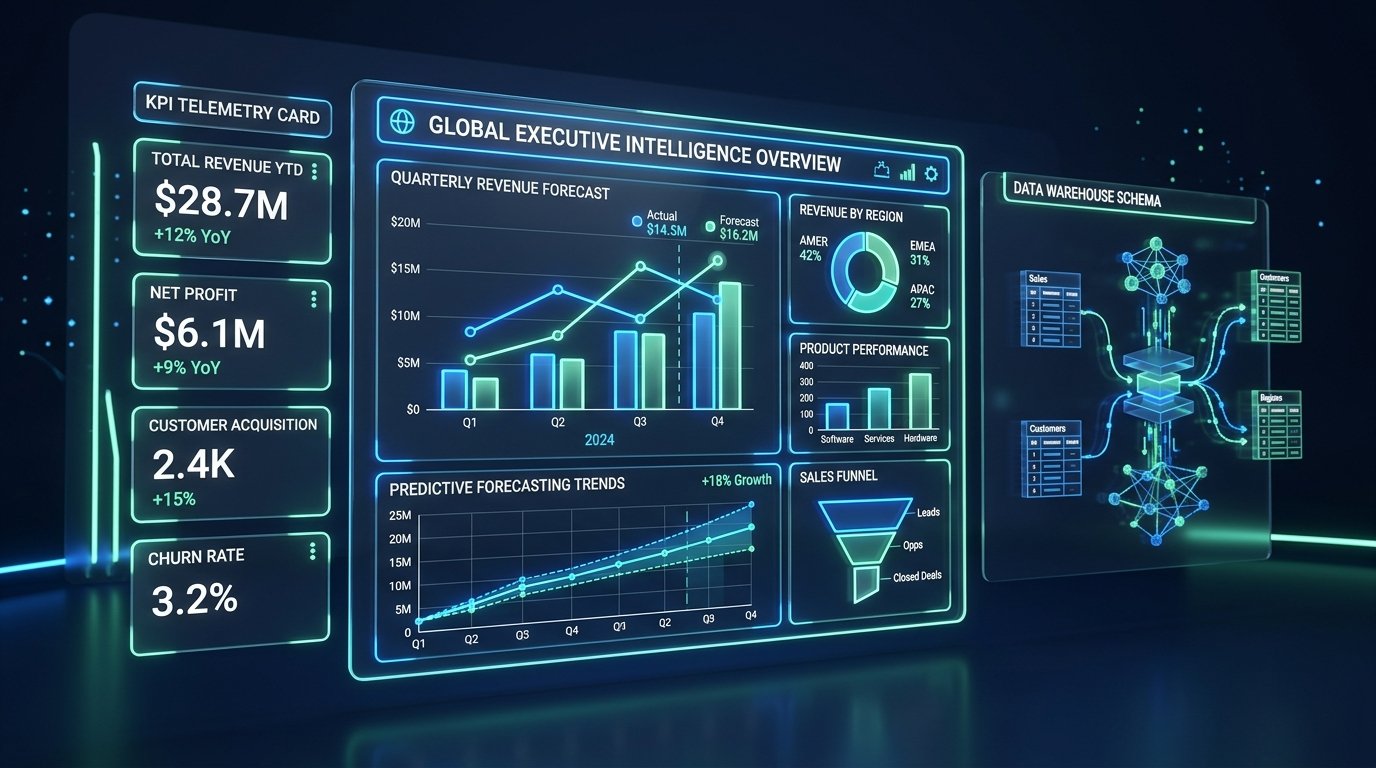
We then craft clean, intuitive dashboards in tools like Power BI, Google Looker Studio, or custom web-based dashboards that update automatically every hour. Your leadership team can monitor revenue trends, customer churn rates, and team productivity with drill-down granularity at a glance.
Core Strategic Advantages
- Automated data extraction from CRMs, ERPs, advertising channels, and databases.
- Centralized data warehousing eliminating manual spreadsheet exports forever.
- Executive KPI dashboards tailored for leadership, sales, and operations teams.
- Real-time anomaly detection and automated scheduled PDF summaries sent to email.
What We Deliver For Business Intelligence
Every capability is executed with clean modular engineering, transparent communication, and measurable business impact.
Executive KPI Dashboard Development
Building interactive dashboards in Power BI, Looker Studio, or custom React interfaces displaying key company metrics.
Automated Data Pipelines & ETL Workflows
Extracting, cleaning, and transforming data from multiple APIs into unified, structured database schemas automatically.
Customer Lifetime Value & Cohort Analysis
Modeling customer acquisition cohorts, retention curves, churn indicators, and payback periods to optimize marketing.
Financial & Revenue Forecasting Models
Visualizing monthly recurring revenue (MRR), gross margins, cash burn rate, and predictive sales pipeline projections.
Database Warehouse Design (Postgres/BigQuery)
Architecting high-speed analytical data warehouses optimized for complex aggregation queries without slowing down production.
Automated Email & Slack Alerting
Configuring scheduled weekly summary emails and instant Slack alerts when key performance indicators spike or dip unexpectedly.
Our 5-Phase Execution Model
No black boxes or surprise delays. Here is the transparent roadmap we follow from initial scope to live release.
KPI Discovery & Data Source Mapping
We identify your critical business decisions, map all existing data sources, and define core KPI calculations.
Deliverable:
KPI Dictionary & Data Source Map
Data Warehouse & Schema Modeling
Designing the analytical schema, normalizing table structures, and configuring database connections.
Deliverable:
Data Warehouse Architecture Spec
Automated ETL Pipeline Engineering
Writing automated scripts and API connectors to pull, clean, validate, and load data on scheduled intervals.
Deliverable:
Operational ETL Pipeline with Error Logging
Dashboard UI Design & Wireframing
Designing uncluttered visualization layouts with custom filters, drill-down capabilities, and responsive charts.
Deliverable:
Interactive Dashboard Beta Build
Data Validation & Team Onboarding
Reconciling dashboard figures against source databases to ensure 100% mathematical accuracy, followed by staff training.
Deliverable:
Production Live Dashboard & Staff Training Video
What You Receive (Tangible Deliverables)
Upon completion of the project, you receive 100% intellectual property ownership and complete access to all project assets:
Common Questions About Business Intelligence
Clear answers to questions about timelines, technology choices, ownership, and ongoing maintenance.
Can you connect our dashboard to tools like Shopify, HubSpot, Google Ads, and QuickBooks?
Yes. We build automated connectors that ingest data from major SaaS platforms, eCommerce engines, advertising networks, and payment gateways via their official REST APIs.
Will building an analytical dashboard slow down our live website database?
No. We never run heavy reporting queries directly against your live transactional database. We replicate data into a dedicated analytical warehouse (such as Postgres or BigQuery) so reporting queries have zero impact on live site performance.
Which BI platform should our company use (Power BI vs Looker Studio vs Custom)?
For companies already using Microsoft 365, Power BI is extremely powerful. For marketing-focused teams, Google Looker Studio offers great free versatility. For SaaS applications offering customer-facing analytics, we build custom embedded React charts.
How do we know the numbers on the dashboard are 100% accurate?
During our validation phase, we perform extensive data reconciliation tests, comparing dashboard totals against raw source invoices and banking records to verify exact formula accuracy.
Can different managers have restricted access to only their specific departmental data?
Yes. We configure role-based access control (RBAC) and row-level security so department heads only see metrics relevant to their team, while executive leadership sees the complete consolidated overview.
Explore Adjacent Services
Complementary Solutions
Web Development
High-performance web applications, fast corporate portals, and conversion-focused websites built with modern React, Next.js, and Laravel backends.
SEO Optimization
Data-driven SEO strategies that build organic visibility, fix technical crawl bottlenecks, and attract high-intent buyer searches.
Digital Marketing
High-ROI paid search, paid social, retargeting funnels, and conversion rate optimization that turn marketing spend into predictable revenue.
Ready to Discuss Your Business Intelligence?
Share your project requirements and goals with us. We will provide a detailed scope analysis, technical roadmap, and transparent quote within 24 hours.